Platform Configuration & Reporting
Every manufacturer’s workflow is different and we make sure Spectron adapts to yours.
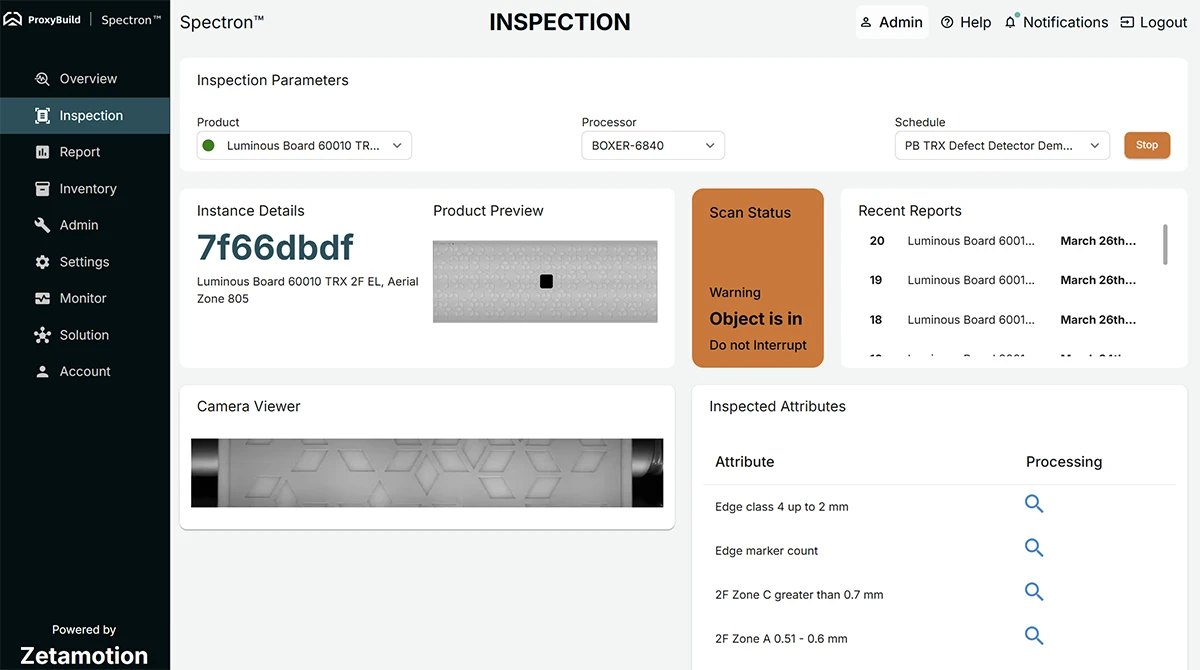
UI & Workflow Configuration
Multi-user license model with role-based access
Product onboarding with guided setup for each variant
Comprehensive dashboards and intuitive navigation
Compatible across stations, lines, and platforms
Quality Rules & Inspection Parameters
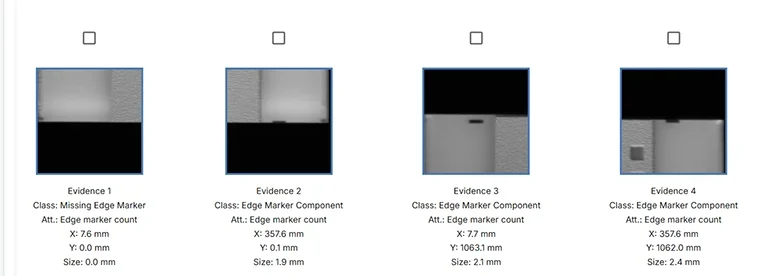
Defect detection and classification
Pass/fail logic with defect severity scoring
Dimensional measurement and component verification
Label reading, video streaming, and more
Reporting & Data Visibility
Real-time dashboards and visual summaries
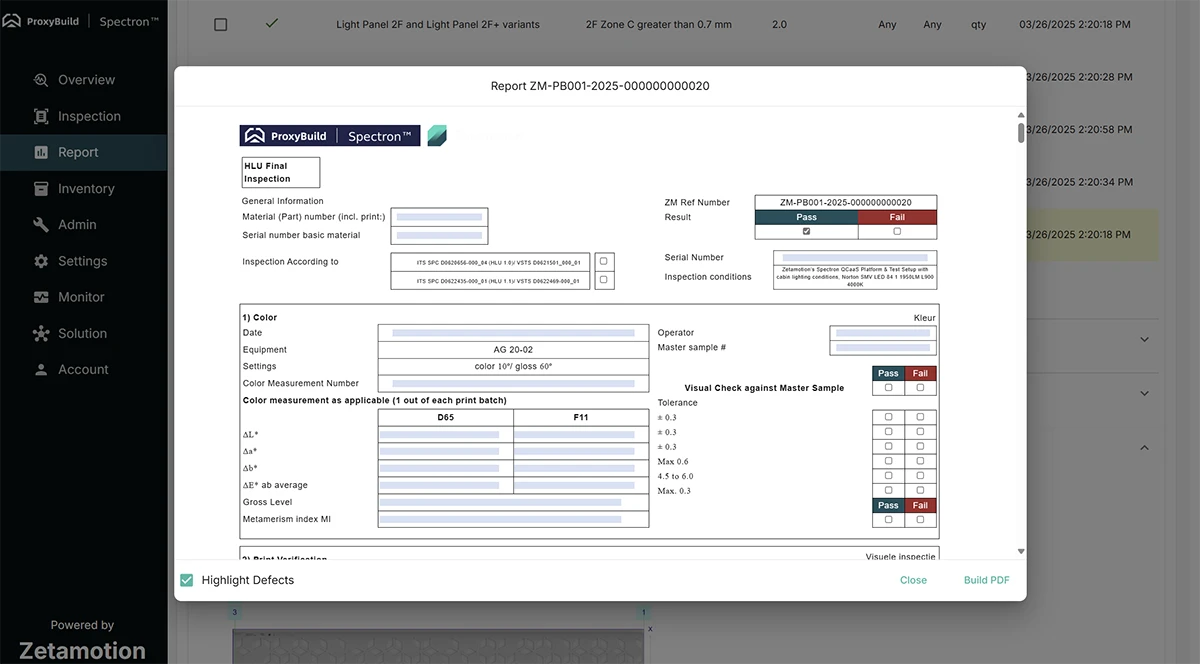
Automated report generation & export capabilities (CSV, PDF etc.)
Historical data for audits, RCA, and continuous improvement
Tailored to your internal processes
Spectron isn’t a black box—it’s a fully configurable platform designed to align with your quality standards, inspection goals, and IT infrastructure. We tailor everything: from inspection rules and station logic to reporting dashboards and data policies.
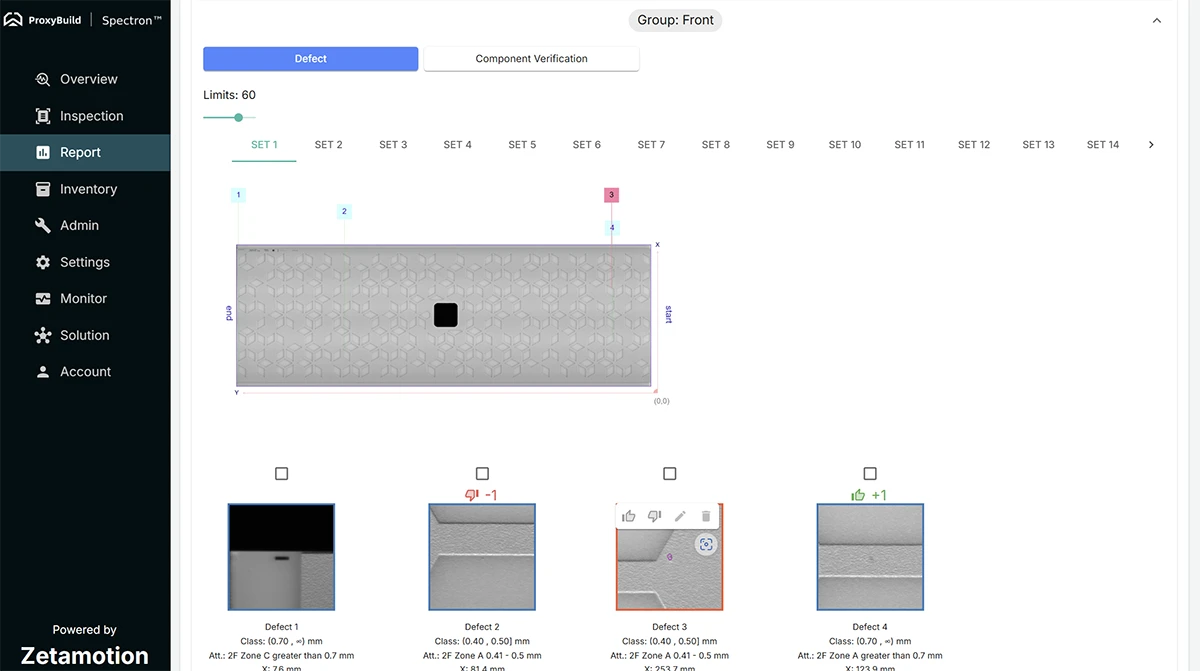
Reporting Overview
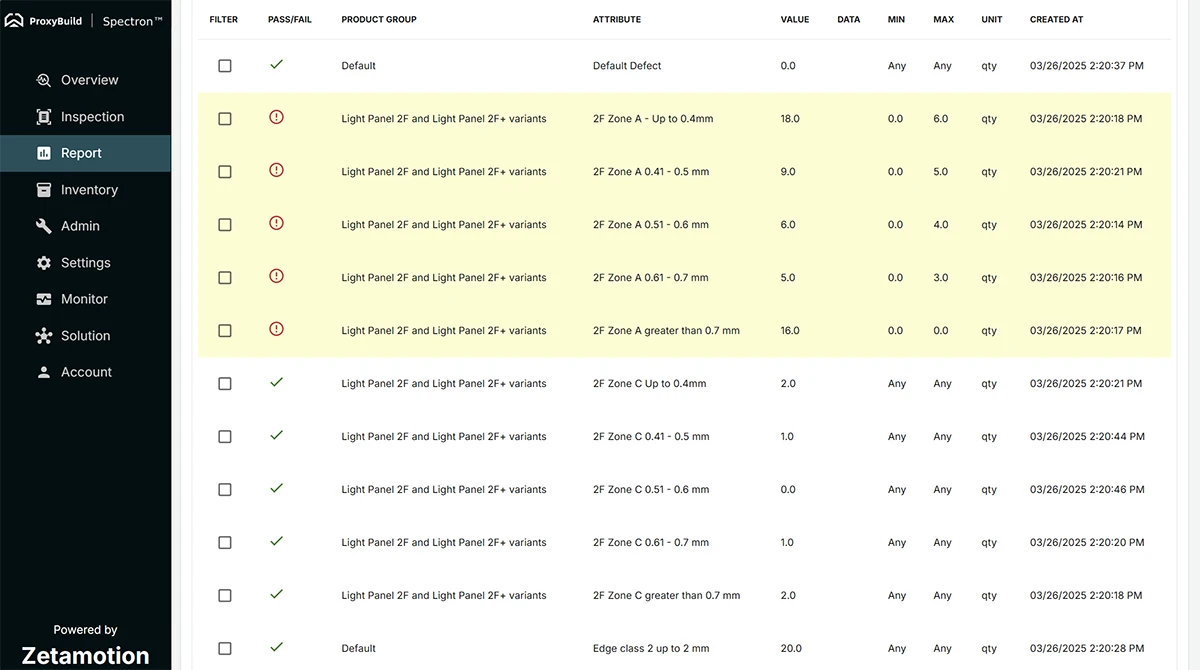
Spectron is fully configurable to match your reporting standards. From the way you define defects to how your team views reports, we tailor the platform around your operations not the other way around.
Data Handling & Security
Full control over data collection, retention, and exchange
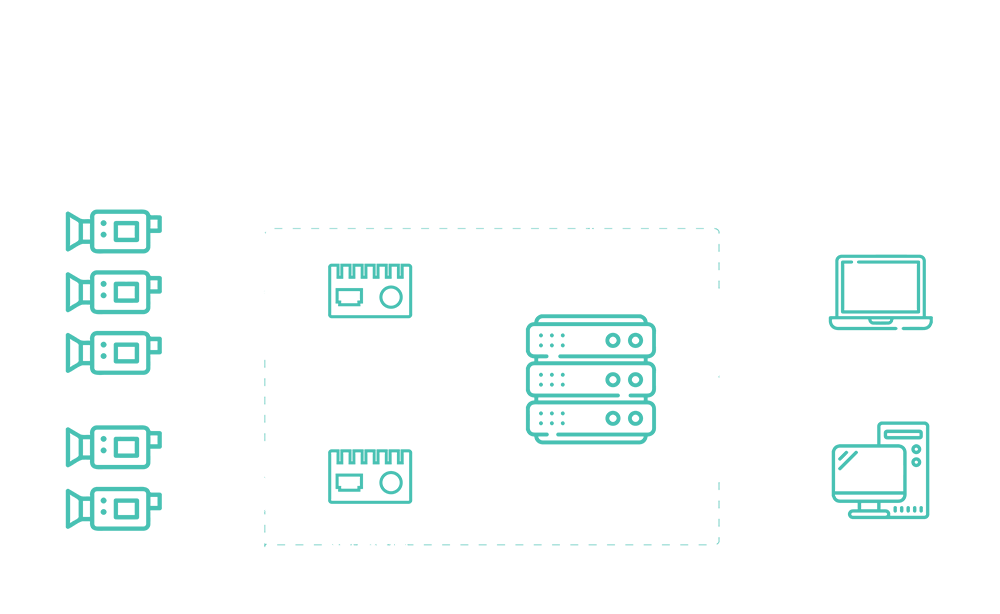
Secure on-prem or hybrid architecture
ISO-compliant cybersecurity protocols
Common platform questions
Yes, you can use the Specification Editor to assign unique min/max values, defect classes, and severity weights to each product group or product variant.
Platform DemoWe tailor the reporting output to your internal needs. A standard report lists inspected attributes, classifications, measured values, pass/fail outcomes, defect screenshots, defect‑map overlays, and downloadable PDFs or CSVs.
Platform demoThe Overview dashboard streams defect counts and reporting statistics over your chosen time periods for you to view live analytics about your production line.
Platform demo